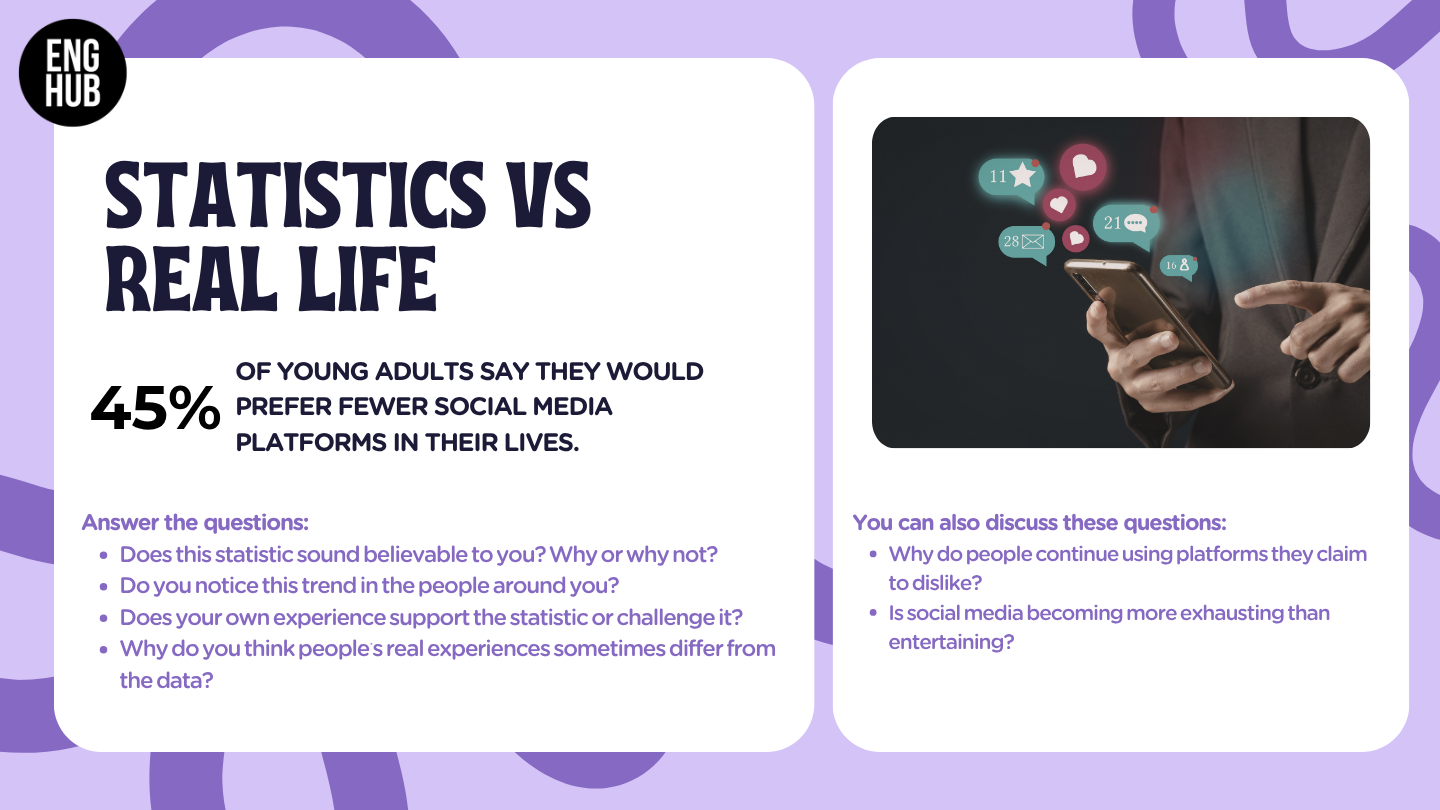
Statistics vs Real Life
B1
B2
C1
Add to saved materials
Speaking activity
Free
Individual work
- The teacher assigns one or more statistic cards with a real-life fact or social trend.
- The student reads the statistic and thinks about whether it reflects their own experience, environment, or opinions.
- The student prepares short ideas and examples to explain why they agree, disagree, or think the reality is more complex than the statistic suggests.
Pair / Group work (including breakout rooms)
- The teacher assigns one or more statistic cards to each pair or group.
- Students work in pairs or small groups (2–4 students).
- They take turns reading the statistics and discussing how true or realistic they seem in everyday life.
- Partners can ask follow-up questions, challenge opinions, or compare experiences from different countries, generations, or social groups.
- Students should focus on giving nuanced opinions, reacting naturally, and supporting their ideas with examples rather than simply agreeing or disagreeing.
Class sharing
- Invite some students or groups to share the most surprising, controversial, or relatable statistics with the class.
- The class can discuss which statistics felt the most accurate, misleading, or thought-provoking.
- Focus on fluency, critical thinking, interaction, and the ability to connect abstract data with real-life experience.
Extra ideas
- Students rank the statistics from “most believable” to “most surprising”.
- Students invent possible reasons behind the statistic before seeing the source.
- Add a prediction stage: students guess how the statistic might change in 10 years.
May, 20
18